Category Archives: geometry

2012-2013 Year In Review – Learning Standards


This is the second post reflecting on this past year and I what I did with my students.

My first post is located here. I wrote about this year being the first time I went with standards based grading. One of the most important aspects of this process was creating the learning standards that focused the work of each unit.

What did I do?

I set out to create learning standards for each unit of my courses: Geometry, Advanced Algebra (not my title – this was an Algebra 2 sans trig), Calculus, and Physics. While I wanted to be able to do this for the entire semester at the beginning of the semester, I ended up doing it unit by unit due to time constraints. The content of my courses didn’t change relative to what I had done in previous years though, so it was more of a matter of deciding what themes existed in the content that could be distilled into standards. This involved some combination of concepts into one to prevent the situation of having too many. In some ways, this was a neat exercise to see that two separate concepts really weren’t that different. For example, seeing absolute value equations and inequalities as the same standard led to both a presentation and an assessment process that emphasized the common application of the absolute value definition to both situations.

What worked:

  • The most powerful payoff in creating the standards came at the end of the semester. Students were used to referring to the standards and knew that they were the first place to look for what they needed to study. Students would often ask for a review sheet for the entire semester. Having the standards document available made it easy to ask the students to find problems relating to each standard. This enabled them to then make their own review sheet and ask directed questions related to the standards they did not understand.
  • The standards focus on what students should be able to do. I tried to keep this focus so that students could simultaneously recognize the connection between the content (definitions, theorems, problem types) and what I would ask them to do with that content. My courses don’t involve much recall of facts and instead focus on applying concepts in a number of different situations. The standards helped me show that I valued this application.
  • Writing problems and assessing students was always in the context of the standards. I could give big picture, open-ended problems that required a bit more synthesis on the part of students than before. I could require that students write, read, and look up information needed for a problem and be creative in their presentation as they felt was appropriate. My focus was on seeing how well their work presented and demonstrated proficiency on these standards. They got experience and got feedback on their work (misspelling words in student videos was one) but my focus was on their understanding.
  • The number standards per unit was limited to 4-6 each…eventually. I quickly realized that 7 was on the edge of being too many, but had trouble cutting them down in some cases. In particular, I had trouble doing this with the differentiation unit in Calculus. To make it so that the unit wasn’t any more important than the others, each standard for that unit was weighted 80%, a fact that turned out not to be very important to students.

What needs work:

  • The vocabulary of the standards needs to be more precise and clearly communicated. I tried (and didn’t always succeed) to make it possible for a student to read a standard and understand what they had to be able to do. I realize now, looking back over them all, that I use certain words over and over again but have never specifically said what it means. What does it mean to ‘apply’ a concept? What about ‘relate’ a definition? These explanations don’t need to be in the standards themselves, but it is important that they be somewhere and be explained in some way so students can better understand them.
  • Example problems and references for each standard would be helpful in communicating their content. I wrote about this in my last post. Students generally understood the standards, but wanted specific problems that they were sure related to a particular standard.
  • Some of the specific content needs to be adjusted. This was my first year being much more deliberate in following the Modeling Physics curriculum. I haven’t, unfortunately, been able to attend a training workshop that would probably help me understand how to implement the curriculum more effectively. The unbalanced force unit was crammed in at the end of the first semester and worked through in a fairly superficial way. Not good, Weinberg.
  • Standards for non-content related skills need to be worked in to the scheme. I wanted to have some standards for year or semester long skills standards. For example, unit 5 in Geometry included a standard (not listed in my document below) on creating a presenting a multimedia proof. This was to provide students opportunities to learn to create a video in which they clearly communicate the steps and content of a geometric proof. They could create their video, submit it to me, and get feedback to make it better over time. I also would love to include some programming or computational thinking standards as well that students can work on long term. These standards need to be communicated and cultivated over a long period of time. They will otherwise be just like the others in terms of the rush at the end of the semester. I’ll think about these this summer.

You can see my standards in this Google document:
2012-2013 – Learning Standards

I’d love to hear your comments on these standards or on the post – comment away please!

Leave a comment

Filed under algebra 2, calculus, geometry, physics, reflection, teaching philosophy, Uncategorized

Building a need for math – similar polygons & mobile devices


The focus of some of my out-of-classroom obsessions right now is on building the need for mathematical tools. I’m digging into the fact that many people do well on a daily basis without doing what they think is mathematical thinking. That’s not even my claim – it’s a fact. It’s why people also claim the irrelevance of math because what they see as math (school math) almost never enters the scene in one’s day-to-day interactions with the world.

The human brain is pretty darn good at estimating size or shape or eyeballing when it is safe to cross the street – there’s no arithmetic computation there, so one could argue that there’s no math either. The group of people feeling this way includes many adults, and a good number of my own students.

What interests me these days is spending time with them hovering around the boundary of the capabilities of the brain to do this sort of reasoning. What if the gut can’t do a good enough job of answering a question? This is when measurement, arithmetic, and other skills usually deemed mathematical come into play.

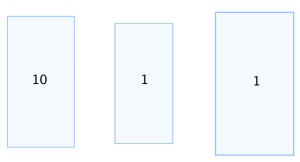
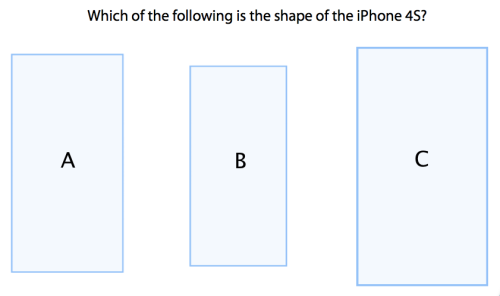
We spend a lot of time looking at our electronic devices. I posed this question to my Geometry and Algebra 2 classes on Monday:
Screen Shot 2013-04-10 at 2.45.41 PM

The votes were five for A, 5 for B, and 14 for C. There was some pretty solid debate about why they felt one way or another. They made sure to note that the corners of the phone were not portrayed accurately, but aside from that, they immediately saw that additional information was needed.

Some students took the image and made measurements in Geogebra. Some measured an actual 4S. Others used the engineering drawing I posted on the class blog. I had them post a quick explanation of their answers on their personal math blogs as part of the homework. The results revealed their reasoning which was often right on. It also showed some examples of flawed reasoning that I didn’t expect – something I now know I need to address in a future class.

At the end of class today when I had the Geometry class vote again, the results were a bit more consistent:
Screen Shot 2013-04-10 at 3.56.40 PM

The students know these devices. Even those that don’t have them know what they look like. It required them to make measurements and some calculations to know which was correct. The need for the mathematics was built in to the activity. It was so simple to get them to make a guess in the beginning based on their intuition, and then figure out what they needed to do, measure, or calculate to confirm their intuition through the idea of similarity. As another chance at understanding this sort of task, I ended today’s class with a similar challenge:

Screen Shot 2013-04-10 at 4.04.31 PM

My students spend much of their time staring at a Macbook screen that is dimensioned slightly off from standard television screen. (8:5 vs. 4:3). They do see the Smartboard in the classroom that has this shape, and I know they have seen it before. I am curious to see what happens.

2 Comments

Filed under geometry, reflection, Uncategorized

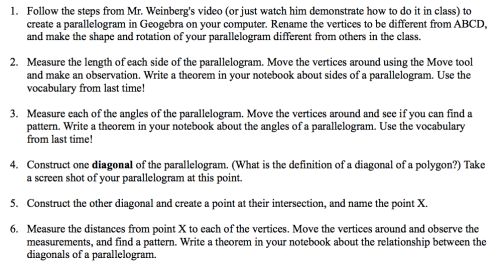
The post where I remind myself that written instructions for computer tasks stink.


It’s not so much that I can’t follow written instructions. I’m human and I miss steps occasionally, but with everything written down, it’s easy to retrace steps and figure out where I went wrong if I did miss something. The big issue is that written instructions are not the best way to show someone how to do something. Text is good for some specific things, but defining steps for completing a task on a computer is not one of them.

Today I showed my students the following video at the start of class.

I also gave them this image on the handout, which I wrote last year, but students only marginally followed:
Screen Shot 2013-02-27 at 5.53.31 PM

It was remarkable how this simple change to delivery made the whole class really fun to manage today.

  • Students saw exactly what I wanted them to produce, and how to produce it.
  • The arrows in the video identified one of the vocabulary words from previous lessons as it appeared on screen.
  • My ESOL students were keeping up (if not outpacing) the rest of the class.
  • The black boxes introduced both the ideas of what I wanted them to investigate using Geogebra, and simultaneously teased them to make their own guesses about what was hidden. They had theories immediately, and they knew that I wanted them to figure out what was hidden through the activity described in the video. Compare this to the awkwardness of doing so through text, where they have to guess both what I am looking for, but what it might look like. You could easily argue this is on the wrong side of abstraction.
  • I spent the class going around monitoring progress and having conversations. Not a word of whole-class direct instruction for the fifty minutes of class that followed showing the video. Some students I directed to algebraic exercises to apply their observations. Others I encouraged to start proofs of their theorems. Easy differentiation for the different levels of students in the room.

Considering how long I sometimes spend writing unambiguous instructions for an exploration, and then the heartbreak involved when I inevitably leave out a crucial element, I could easily be convinced not to try anymore.

One student on a survey last year critiqued my use of Geogebra explorations saying that it wasn’t always clear what the goal was, even when I wrote it on the paper. These exploratory tasks are different enough and more demanding than sitting and watching example problems, and require a bit more selling for students to buy into them being productive and useful. These tasks need to quickly define themselves, and as Dan Meyer suggests, get out of the way so that discovery and learning happens as soon as possible.

Today was a perfect example of how much I have repeatedly shot myself in the foot during previous lessons trying to establish a valid context for these tasks through written instructions. The gimmick of hiding information from students is not the point – yes there was some novelty factor here that may have led to them getting straight to work as they did today. This was all about clear communication of objectives and process, and that was the real power of what transpired today.

4 Comments

Filed under geogebra, geometry, reflection

Results of a unit long experiment in SBG and flipping.


I’ve been a believer in the concept of standards based instruction for a while. The idea made a lot of sense when I first learned about the idea when Grant Wiggins visited my school in the Bronx a few years ago to present on Understanding by Design. Dan Meyer explored the idea quite a bit using his term of the concept checklist. Shawn Cornally talks on his blog about really pushing the idea to give students the freedom to demonstrate their learning in a way they choose, though he ultimately retains judgment power on whether they have or not. Countless others have been really generous in sharing their standards and their ideas for making standards work for their students. Take a look at my blogroll for more people to read about. For those unaware, here’s the basic idea: Look at the entire unit and identify the specific skills or you want your students to have. Plan your unit to help them develop those skills. Assess and give students feedback on those skills as often as possible until they get it. In standards based grading (SBG), reporting a grade (as most of us are required to do) as a fraction of standards completed or acquired becomes a direct reflection of how much students have learned. Compare this to the more traditional version of grading that consists of an average of various ‘snapshots’ on assignments, on which grades might be as much a reflection of effort or completion as of actual learning. If learning is to be the focus of what we do in the classroom, then SBG is a natural way of connecting that learning to the grades and feedback we give to students. My model for several years now has been, well,  SBG lite. Quizzes are 15% of the total grade and test only a couple skills at a time. Students can retake quizzes as many times as they want to show that they have the skills in isolation. On tests, (60% of the total grade) students can show that they can correctly apply the set of all of their acquired skills on exercises (questions they have seen before) as well as problems (new questions that test conceptual understanding). As much as I tell students they can all have a grade of 100% for quizzes and remind those that don’t to retake, it doesn’t happen. I’ll get a retake here or there. I am still reporting quiz grades as an average of a pool of “points” though, and this might leave enough haziness in the meaning of the grade for a student to be OK with a 60%. For this unit in Geometry and Algebra 2, I have specifically made the quiz grade a set of standards to be met. The point total is roughly the same as in previous units. It is a binary system – students either have the standard (3/3) or they don’t (0/3), and they need to assess each standard at least twice to convince me they have it. I really like Blue Harvest, but my students didn’t respond so well to having twowhole websites to use to check progress. While a truly scientific study would have changed only one variable at a time, I also found that structuring the skill standards this way required me to change the way class itself was structured. This became an experiment not only in reporting grades, but in giving my students the power to work on things in their own way. This also freed me up to spend my time in class assessing, giving feedback, and assessing again. More on this ahead. The details:

Geometry

I started the unit by defining the seven skills I wanted the students to have by the end on this page. The unit was on transformational geometry, so a lot of the skills were pretty straight forward applications of different types of transformations to points, line segments, and polygons. I had digital copies of all of the materials I put together last year for this unit, so I was able to post all of that material on the wiki for students to work through on their own. I adjusted these materials as we moved through the unit and as I saw there were holes in their understanding. I was also able to make some videos using Jing and Geogebra to explain some concepts related to using vocabulary and symmetry, and these seemed to help some students that needed a bit of direct instruction in addition to what I provided to them one on one. I also tried another experiment – programming assignments related to applying transformations to various points. I said completing these assignments and chatting with me about them would qualify them for proficiency on a given standard. Assigning homework was simple: Choose a standard or two, and do some of the suggested problems related to those standards. Be prepared to show me your evidence of study when you come into class. Students that said ‘I read my notes’ or ‘I looked it over’ were heckled privately – the emphasis was on actively working to understand concepts. Some students did flail a bit with the new freedom, so I made suggestions for which standards students should spend a particular day working on, and this helped these students to focus. I threw together some concept quizzes for the standards covered by the previous classes, and students could choose to work on those question types they felt they had mastered. Some handed the quiz right back knowing they weren’t ready. I was really pleased with the level of awareness they quickly developed around what they did and didn’t understand. I quickly ran into the logistical nightmare of managing the paperwork and recording assessment results. Powerschool Blue Harvest, whatever – this was the most challenging aspect of doing things this way. I often found myself bogged down during the class period recording these things, which got in the way of spending quality face time with students around their understanding. Part of this was that I was recording progress for each standard, whether good or bad, in the comment field for each student. “Understands basic idea of translation, but is confusing the image and pre-image” is the sort of comment I started writing in the beginning. While this was nice, and I think could have led to students reading the comments and getting ideas for what they needed to work on, it was a bit redundant since I was having actual conversations with students about these facts. Here is where Blue Harvest shines – I can easily send students a quick message explaining (and showing) what they need to work on. Even more powerful would be recording the conversation when I actually talk to the student, but that would be more practical with an iPad/cell phone app to avoid lugging my computer from desk to desk. Still, I wanted the feedback to be immediate and be recorded, so I knew I had to change my approach. The compromise was to only record positive progress. If a student’s quiz showed no progress, it didn’t get a comment in Powerschool. If they showed progress, but needed to fix a small detail in their understanding, they might get a comment. If they clearly got it, they got a comment saying that they aced it. Two or more positive comments (and my independent review) led to a 3/3 for each standard. The other promise I made was that if they clearly demonstrated proficiency on the exam (which had non-standard questions and some things they needed to explain) I would give them credit for the standard. The other difficult issue was creating a bank of reassessment questions. My system of making a quiz on the spot and handing it out to individual students was too time consuming. I created an app(using my new Udacity knowledge) to try to do this, the centerpiece being a randomized set of questions that emphasized knowing how to figure out the answers rather than students potentially sharing all the answers. They quickly found all the bugs in my system, and showed that it is far from ready for being an actual useful tool for this purpose. I appreciated their humor and patience in being guinea pigs for an idea. As you might notice from the image above, there is a pretty strong relationship between the standards mastered and the exam scores. Most student exam scores were either the same or better following this system in comparison to previous exams. The most important metric is the fact that most students weren’t hurt by going to this more student-centered model. Some student took more notes while working to understand the material than they have all year. Other students spoke more to their classmates and both gave and received more help in comparison to when I was at the front of the room asking questions and doing mini-lessons. While there was a lot of staring at screens during this unit, there was also a lot of really great discussion. I would have focused conversations with every single student three to four times a class, and they were directly connected to the level of understanding they had developed. Some needed direct application questions. Others could handle deeper synthesis and ‘why is this true’ questions about more abstract concepts. It felt really great doing things this way. I have always insisted on crafting one good solid presentation to give the class – the perfect lesson – with good questions posed to the class and discussions inevitably resulting from them. I have to admit that having several smaller, unplanned, but ‘messier’ conversations to guide student learning have nurtured this group to be more independent and self driven than I expected before we started.

Algebra 2

The unit focused on the students’ first exposure to logarithmic and exponential functions. The situation in Algebra 2 was very similar to Geometry, with one key difference. The main difference of this class compared to Geometry is that almost all of the direct instruction was outsourced to video. I decided to follow the Udacity approach of several small videos (<3 min), because that meant there was opportunity (and the expectation) that only two minutes would go by before students would be expected to do something. I like this much better because it fit my own preferences in learning material with the Udacity courses. I had 2 minutes to watch a video about hash functions in Python while brushing my teeth – my students should have that ability too. I wasn’t going for the traditional flipped class model here. My motivation was less about requiring students to watch videos for homework, and more about students choosing how they wanted to go through the material. Some students wanted me to do a standard lesson, so I did a quick demonstration of problems for these students. Others were perfectly content (and successful) watching the video in class and then working on problems. Some really great consequences of doing things this way:

  • Students who said they watched all my videos and ‘got it’ after three, two minute videos, had plenty of time in the period to prove it to me. Usually they didn’t.. This led to some great conversations about active learning. Can you predict the next step in the video when you try solving the problem on your own? What? You didn’t try solving it on your own? <SMIRK>  The other nice thing about this is that it’s a reinvestment of two minutes suggesting that they try again with the video, rather than a ten or fifteen minute lesson from Khan Academy.
  • I’ve never heard such spirited conversation between students about logarithms before. The process of learning each skill became a social event – they each watched the video together, rewound or paused as needed, and then got into arguments while trying to solve similar problems from the day’s handout. Often this would get in the way during teacher-centered lessons, and might be classified incorrectly as ‘disruption’ rather than the productive refining and conveyance of ideas that should be expected as part of real learning.
  • Having clear standards for what the students needed to be able to do, and making clear what tools were available to help them learn those specific standards, led to a flurry of students demanding to show me that they were proficient. That was pretty cool, and is what I was trying to do with my quiz system for years, but failed because there was just too much in the way.
  • Class time became split between working on the day’s standards, and then stopping at an arbitrary time to then look at other cool math concepts. We played around with some Python simulations in the beginning of the unit, looked at exponential models, and had other time to just play with some cool problems and ideas so that the students might someday see that thinking mathematically is not just followinga list of procedures, it’s a way of seeing the world.

I initially did things this way because a student needed to go back to the US to take care of visa issues, and I wanted to make sure the student didn’t fall behind. I also hate saying ‘work on these sections of the textbook’ because textbooks are heavy, and usually blow it pretty big. I’m pretty glad I took this opportunity to give it a try. I haven’t finished grading their unit exams (mostly because they took it today) but I will update with how they do if it is surprising.


Warning: some philosophizing ahead. Don’t say I didn’t warn you. I like experimenting with the way my classroom is structured. I especially like the standards based philosophy because it is the closest I’ve been able to get to recreating my Montessori classroom growing up in a more traditional school. I was given guidelines for what I was supposed to learn, plenty of materials to use, and a supportive guide on the side to help me when I got stuck. I have seen a lot of this process happening with my own students – getting stuck on concepts, and then getting unstuck through conversation with classmates and with me. The best part for me has been seeing my students realize that they can do this on their own, that they don’t always need me to tell them exactly what to do at all times. If they don’t understand an idea, they are learning where to look, and it’s not always at me. I get to push them to be better at what they already know how to do rather than being the source of what they know. It’s the state I’ve been striving to reach as a teacher all along, and though I am not there yet, I am closer than I’ve ever been before. It’s a cliche in the teaching world that a teacher has done his or her job when the students don’t need you to help them learn anymore. This is a start, but it also is a closed-minded view of teaching as mere conveyance of knowledge. I am still just teaching students to learn different procedures and concepts. The next step is to not only show students they can learn mathematical concepts, but that they can also make the big picture connections and observe patterns for themselves. I think both sides are important. If students see my classroom as a lab in which to explore and learn interesting ideas, and my presence and experience as a guide to the tools they need to explore those ideas, then my classroom is working as designed. The first step for me was believing the students ultimately wantneed to know how to learn on their own. Getting frustrated that students won’t answer a question posed to the entire class, but then will gladly help each other and have genuine conversations when that question comes naturally from the material. All the content I teach is out there on the internet, ready to be found/read/watched as needed. There’s a lot of stuff out there, but students need to learn how to make sense of what they find. This comes from being forced to confront the messiness head on, to admit that there is a non-linear path to knowledge and understanding. School teaches students that there is a prescribed order to this content, and that learning needs to happen within its walls to be ‘qualified’ learning. The social aspect of learning is the truly unique part of the structure of school as it currently exists. It is the part that we need to really work to maintain as content becomes digital and schools get more wired and connected. We need to give students a chance to learn things on their own in an environment where they feel safe to iterate until they understand. That requires us as teachers to try new things and experiment. It won’t go well the first time. I’ve admitted this to my students repeatedly throughout the past weeks of trying these things with my classes, and they (being teenagers) are generous with honest criticism about whether something is working or not. They get why I made these changes. By showing that iteration, reflection, and hard work are part of our own process of being successful, they just might believe us when we tell them it should be part of theirs.

1 Comment

Filed under algebra 2, geometry, reflection, teaching philosophy, teaching stories

Socializing in Geometry – Similar Triangles


Another successful experiment getting my participation-challenged geometry class to interact with each other yesterday.

Each student received a cut-out triangle from the image at left. The challenge:

One (or possibly two) people in this room have triangles similar to yours. Your task is to find the person and do the following:

  • Find the similarity ratio between your triangle and your match in the order big:small.
  • Determine the ratio of the perimeters of each of your triangles.
  • Determine the ratio of the areas of each of your triangles.

I then cut them loose. Almost immediately they started scrambling around the classroom holding up triangles and calculating as quickly as possible. (I didn’t totally get why they were in a hurry, actually.) They clustered on tables and rapidly shifted partners until everyone found they were in the right place. The calculating began for perimeter – that was the easy part. Then the area question took center stage.

Some asked me how to find the heights of the triangles, and I shrugged my shoulders with the smirk of someone with ideas that isn’t sharing them. (I call this my ‘jerk’ mode that I love taking on during class for the sole reason that it gets them finding and figuring on their own.) Some recreated the triangle in Geogebra. Some superimposed it over graph paper and counted to get an estimate. One student cleverly found Heron’s formula. It was really entertaining watching them excitedly explain the formula without writing it down (something else I didn’t understand) and share how it quickly and easily allows the area to be calculated. The energy in the room was apparent as they ran from person to person trying to get everyone to complete the task. Eventually they found out themselves that the similarity ratio was a square relationship. I didn’t have to do a thing.

Part of my justification in doing this was to get them thinking about the important ideas necessary in solving another problem I threw their way during the previous class comparing the old iPad to the new one. The two different groups that had worked on it were generally on the right track, but there were some serious errors in their reasoning that I hinted at but didn’t explicitly point out to them. I think this activity closed the gap. There should be some interesting answers to discuss in class when we next meet.

Leave a comment

Filed under geometry, teaching stories

Party games & geometry definitions


Today’s geometry class started with a new random arrangement of student seats. It never fails to amaze me how the dynamics of the whole room change with a shuffle of student locations.

The lesson today was the first of our quadrilateral unit. Normally after tests, I don’t tend to have homework assignments, but I decided to make an exception with a simple assignment:

Create a single Geogebra file in which you construct and label all of the quadrilaterals given in the textbook: parallelogram, rhombus, square, kite, rectangle, trapezoid, and isosceles trapezoid.

This appealed to me because I really dislike lessons in which we go through definitions slowly as a group. I also knew that giving the students some independence in reviewing or learning the definitions of these quadrilaterals was a good thing. Sometimes they are a bit to reliant on me to give them all the information they need. For this assignment, students would need to understand the definitions of quadrilaterals in order to construct them, and that was a good enough for walking into class today.

The warm-up activity involved looking at unlabeled diagrams of quadrilaterals, naming them, and writing any characteristics they noticed about them from the diagrams:

Some had trouble with the term ‘characteristics’, but a peek down at the chart just below on the paper helped them figure it out:

Based on what they knew from the definitions before class, I had them complete this chart while talking to their new partner. There was lots of good conversation and careful use of language for each listed characteristic.

This led to the next thing that often serves as an important (though often boring) exercise: new vocabulary. I used one of my favorite activities that gets students focused on little details – each student received one of the following four charts. The chart is originally from p. 380 of the AMSCO Geometry textbook, and was digitally ruined using GIMP.

The students had a good time filling in the missing information and conferring with each other to make sure they had it all. We then came up with some examples of consecutive vertices, angles, diagonals, and opposite sides.


From their work with the chart and using the new vocabulary whenever possible, we then did the following:

What information would you need in order to prove that a quadrilateral is… (use as much of the new vocabulary as possible!)

  • a square?

  • a rhombus?

  • a parallelogram?

  • a rectangle?

  • a trapezoid? (an isosceles trapezoid?)

  • a kite?

I was really pleased with how they did with this exercise – they really seemed to be interacting with the definitions and vocabulary well.

Finally, we arrived at the part that was the most fun. You know that annoying ice-breaker you sometimes are forced to do at professional development sessions where you wear something on your head and have to get the other attendees to tell you who you are?

I hate that activity. That usually means it’s perfect for my students:

Here are the quadrilaterals:
Quadrilaterals – Who-Am-I activity

The students were all smiles during the ten minutes or so we spent going through it – yes, I had one too! They were using the vocabulary we had developed during the day and were pretty creative in getting each other to guess the dog names as well.

In the end, I feel pretty good about how today’s set of activities went. The engagement level was pretty high and everyone did a good job of interacting with the definitions in a way that will hopefully lead to understanding as we start proving their properties in coming classes.

Leave a comment

Filed under geometry, reflection, teaching stories

Students #flipping class presentations through making videos


Those of you that know the way I usually teach probably also know that projects are not in my comfort zone. I always feel they need to be well defined in such a way to make it so that the mathematical content is the focus, and NOT necessarily about how good it looks, the “flashy factor”, or whether it is appropriately stapled. As a result, I often avoid them like the plague. The activities we do in class are usually student centered and involve  a lot of student interaction, and occasionally (much to my dismay) are open ended problems to be solved.

Done well, a good project (and rubric) also involves a good amount of focused interaction between students about the mathematical content. I don’t like asking students to make presentations either – what often results is a Powerpoint and students awkwardly gesturing at projected images of text that they then read to the group in front of them. In class, I openly mock adults who do this to my students – I keep the promise that I will never ask them to read to me and their peers standing at the front of the room. Presentation skills are important, don’t get me wrong, but I don’t see educational gold in the process, or get all tingly about ‘real-world skill development’ from assigning in-class presentations. They instill fear in the hearts of many students (especially those that are students of ESOL) and require  tolerance from the rest of the class and involved adults to sit through watching them, and require class time in order to ‘make’ students watch them.

I’m also not convinced they actually learn content by creating them. Take a bunch of information found on Wikipedia or from Google, put it on a number of slides, and read it slowly until your time is up. Where is the synthesis? Where is the real world application of an idea that the student did? What new information is the student generating? If there’s very little substantive answer to those questions, it’s not worth it. It’s no wonder why they go the Powerpoint slide route either – it’s generally what they see adults doing when they present something.

In short, I don’t like asking students to do something that even adults don’t typically do well, and even then without the self-esteem and image issues that teenagers have.

All of that said, I really liked seeing a presentation (a good one, mind you) from Kelly Grogan (@KellyEd121) at the Learning 2.011 conference in Shanghai this past September. She has her students combine written work, digital media, audio, and video into digital documents that can be easily shared with each other and with her as their teacher. The additional dimension of hearing the student talking about his/her work and understanding is a really powerful one. It is but one distilled aspect of what we want students to get out of the projects we assign.

The fact that it isn’t live also takes away a lot of the pressure to get it all right in one take. It also takes advantage of the asynchronous capability that technology affords us – I can watch a student’s product at home or on my iPad at night, as can the other students. I like how it uses the idea of the flipped classroom to change the idea of student presentations. Students present their understanding or work through video that can be watched at home,  and then the content can be discussed or used in class the next day.

It was with all of this in mind that I decided to assign the project described here:

http://wiki.hischina.org/groups/gealgerobophysiculus/wiki/57f0c/Unit_5__Living_Proof_Video_Project.html

The proofs were listed on a handout given in class, and students in groups of two chose which proof they wanted to do. Most students submitted their videos today. I’m pretty pleased with how they ran with the idea and made it their own. Some quick notes:

  • The mathematical content is the focus, and the students understood that from the beginning. While the math isn’t perfect in every video, the enthusiasm the students had for putting these together was pretty awesome to watch. There’s no denying that enthusiasm as a tool for helping students learn – this is a major plus for project based assignments.
  • Some students that rarely volunteer to speak in class have their personalities and voices all over these. I love this.

My plan to hold students accountable for watching these is to have variations of them on the unit test in a couple weeks. I don’t have to force the students to watch them though – they had almost all shared them before they were due.

Yes, you heard that right. They had almost all shared their work with each other and talked about it before getting to class. I sometimes have to force this to happen during class, but this assignment encouraged them to do it on their own. Now that’s cool.

I have ideas for tweaking it for next time, but I really liked what came out of this. I’ve been hurt(stung?)  by projects before – giving grades that meet the rubric for the project, but don’t actually result in a grade that indicates student learning.

I can see how this concept could really change things though. There’s no denying that the work these students produced is authentic to them, and requires engagement with the content. Isn’t that what we ultimately want students to know how to do when they leave our classroom?

Leave a comment

Filed under geometry, reflection, studentwork, teaching philosophy

Math is everywhere! – fractals on the Franz Josef glacier


One of the stops on our New Zealand adventure was at the Franz Josef glacier on the West coast. We went on the full day hike which gave us plenty of time to explore the various ice formations on the glacier under the careful eye of our guide. Along the way up the glacier, I took the following series of pictures:

All of these were taken on the way up the glacier. Can you tell in what order I took them? If you’re like my students (and a few others I have shown these to), you will likely be incorrect.

I realized as I was walking that this might be because of the idea of self-similarity, a characteristic of fractals in which small parts are similar to the whole. When I showed this set of pictures to my geometry class, I then showed them a great video video zooming in on the Mandelbrot fractal to show them what this meant.

The formations in the ice and the sizes of the rocks broken off my the glacier contributed to the overall effect. Here is another shot looking down the face of the glacier in which you can see four different groups of people for a size comparison:


The cooler thing than seeing this in the first place was discovering that it’s a real phenomenon! There are some papers out there discussing the fact that the grain size distribution of glacial till (the soil, sand, and rocks broken off by the glacier) is consistent throughout a striking range of magnitudes. The following chart is from Principles of Glacier Mechanics by Roger Leb. Hooke:


In case you are interested in exploring these pictures more, here are the full size ones in the same A-B-C-D order from above:


Oh, and in case you are wondering, the correct order is B-C-A-D.

Leave a comment

Filed under geometry, teaching stories, Uncategorized

Geogebra for Triangle Congruence Postulates


It has been busy-ville in gealgerobophysicsulus-town, so I have barely had time to catch my breath over the last few days of music performances, school events, and preparations for the end of the semester.

My efforts over the  past couple days in Geometry have focused on getting in a bit of understanding of congruent triangles. We have used some Geogebra sketches I designed to have them build a triangle with specific requirements. With some feedback from some Twitter folks (thanks a_mcsquared!) and students after doing the activities, I’ve got these the way I want them.

Constructing a 7-8-9 triangle: Download here. (For discovering SSS)

Constructing a 3-4-45 degree triangle: Download here. (For discovering SAS)

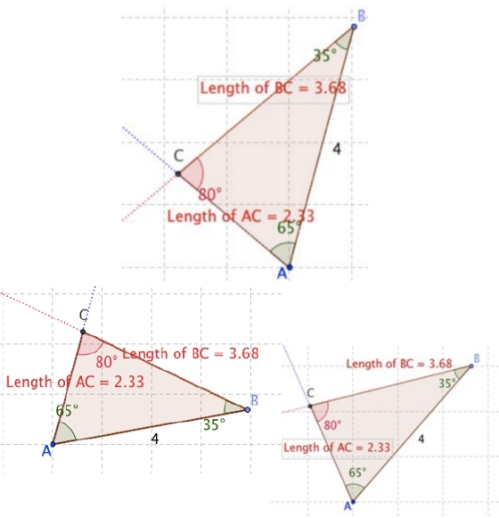
Looking for an ASA postulate. Download here. (Clearly for ASA explorations.) – This one I made a quick change before class to making it so that the initial coordinates of the base of the triangle are randomized when loading the sketch. This almost guarantees that every student will have a differently oriented triangle. This makes for GREAT conversations in class. Here are three of the ones students created this afternoon:

I’m doing a lot of thinking about making these sorts of activities clearly driven by simple, short instructions. This is particularly in light of a few of the students in my class with limited English proficiency. Creating these simple activities is also a lot more fun than just asking students to draw them by hand, guess, or just listen to me tell them the postulates and theorems. Having a room full of different examples of clearly congruent triangles calls upon the social aspect of the classroom. Today they completed the activity and showed each other their triangles and had good interactions about why they knew they had to be congruent.

Last year I had them construct the triangles themselves, but the power of the end message was weakened by the written steps I included in the activity. Giving them clear instructions made the final product, a slew of congruent (or at least approximately in the case of 7-8-9) triangles a nice “coincidence” to lead to generalizing the idea.

Leave a comment

Filed under geogebra, geometry

Testing expected values using Geogebra


I was intrigued last night looking at Dan Meyer’s blog post about the power of video to clearly define a problem in a way that a static image does not. I loved the simple idea that his video provoked in me – when does one switch from betting on blue vs. purple? This gets at the idea of expected value in a really nice and elegant way. When the discussion turned to interactivity, Geogebra was the clear choice.

I created this simple sketch (downloadable here)as a demonstration that this could easily be turned into an interactive task with some cool opportunities for collecting data from classes. I found myself explaining the task in a slightly different way to the first couple students I showed this to, so I decided to just show Dan’s video to everyone and take my own variable out of the experiment. After doing this with the Algebra 2 (10th grade) group, I did it again later with Geometry (9th) and a Calculus student that happened to be around before lunch.

The results were staggering.

Each colored point represents a single student’s choice for when they would no longer choose blue. Why they chose these was initially beyond me. The general ability level of these groups is pretty strong. After a while of thinking and chatting with students, I realized the following:

  • Since the math level of the groups were fairly strong, there had to be something about the way the question was posed that was throwing them off. I got it, but something was off for them.
  • The questions the students were asking were all about winning or losing. For example, if they chose purple, but the spinner landed on blue, what would happen? The assumption they had in their heads was that they would either get $200 or nothing. Of course they would choose to wait until there was a better than 50:50 chance before switching to purple. The part about maximizing the winnings wasn’t what they understood from the task.
  • When I modified the language in the sketch to say when do you ‘choose’ purple instead of ‘bet’ on the $200  between the Algebra 2 group and the Geometry group, there wasn’t a significant change in the results. They still tended to choose percentages that were close to the 50:50 range.

Dan made this suggestion:

I made an updated sketch that allowed students to do just that, available here in my Geogebra repository. It lets the user choose the moment for switching, simulates 500 spins, and shows the amount earned if the person stuck to either color. I tried it out on an unsuspecting student that stayed after school for some help, one of the ones that had done the task earlier.

Over the course of working with the sketch, the thing he started looking for was not when the best point to switch was, but when the switch point resulted in no difference in the amount of money earned in the long run by spinning 500 times. This, after all, was why when both winning amounts were $100, there was no difference in choosing blue or purple. This is the idea of expected value – when are the two expected values equal? When posed this way, the student was quickly able to make a fairly good guess, even when I changed the amount of the winnings for each color using the sketch.

I’m thinking of doing this again as a quick quiz with colleagues tomorrow to see what the difference is between adults and the students given the same choice. The thing is, probably because I am a math teacher, I knew exactly what Dan was getting at when I watched the video myself – this is why I was so jazzed by the problem. I saw this as an expected value problem though.

The students had no such biases – in fact, they had more realistic ones that reflect their life experiences. This is the challenge we all face designing learning activities for the classroom. We can try our best to come up with engaging, interesting activities (and engagement was not the issue – they were into the idea) but we never know exactly how they will respond. That’s part of the excitement of the job, no?

5 Comments

Filed under algebra 2, geogebra, geometry, reflection, teaching stories